Avocado Finance Forecast Methodology
One of the hardest parts of personal finance is knowing how your Net Worth will change over time. Income, expenses, investments, debt, and assets can all feel like moving targets that make it hard to plan more than a couple of years out, so many people resort to simple rules of thumb and basic assumptions.
To help you build a smarter long-term plan and remove financial uncertainty out for your life, we built Avocado Finance. Our App combines your financial and personal data to project your financial future. With Avocado Finance, you can see your expected Net Worth for any date in the future and you’ll have all the data you need to plan ahead. Use it to make life’s most important personal finance decisions, achieve your financial goals, and ensure you are on path to financial freedom.
This document explains how Avocado Finance’s algorithm forecasts your financial future.
TABLE OF CONTENTS
Net Worth Forecast
The Net Worth Forecast shows your expected Net Worth balance for any date in the future.

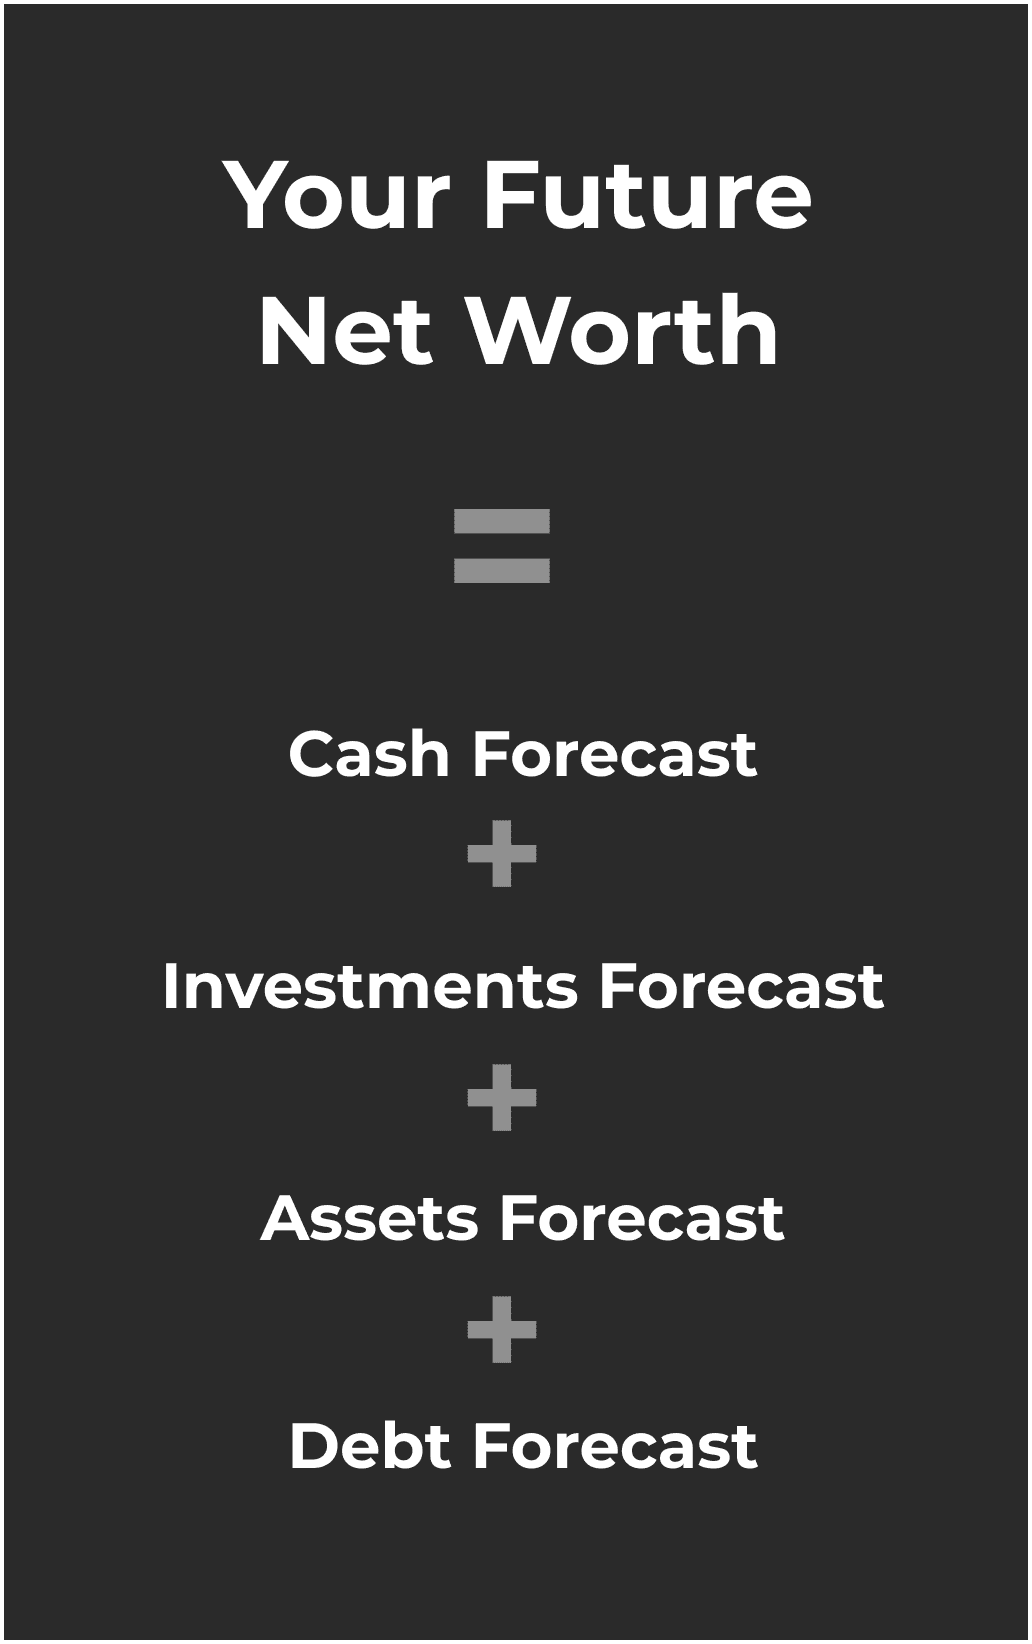
Your Net Worth is comprised of many different pieces. To get a true comprehensive picture of your finances, we take into consideration of all the moving variables. We break up Net Worth into 4 components: cash, investments, assets, and debt. Then, we forecast the 4 components individually and combine them to ensure accuracy. You’ll be able to see what your future Net Worth will look like for any date in the future, and in essence, your financial future. The following sections detail how each of the 4 components of your future Net Worth are individually calculated to create a representative picture of you.
Cash Balance Forecast
The Cash Balance Forecast shows your expected Cash Balance for any date in the future.

(A) Today’s Cash Balance from Your Synced Accounts
The amount of cash you have today from your synced financial accounts. We get this data from your synced accounts and it’s updated on its own as your balance goes up or down. The types of accounts included are checkings, savings, and money market accounts.
(B) Your Cash Inflow
The amount of cash you are expected to earn. There are two types of Cash Inflow.
(1) Your Income
• Your after-tax income
• We ask you to provide your annual salary, state location, filing status. Our algorithm automatically calculates and deducts your state and federal taxes, just like the IRS does
(2) Other Inflow
• Other sources of cash that increases your Cash Balance (such as one-time cash deposits)
• This cash inflow is added to your Cash Balance automatically when you deposit the cash into a synced financial account
• In example, if you are gifted $500 of cash from family, your Cash Balance will go up automatically when you deposit that $500 into your synced financial account
(C) Your Cash Outflow
The amount of cash that you are expecting to spend. There are two types of Cash Outflow.
(1) Your Spend
• Your regular expenses
• We ask you to provide your recurring expenses such as car payments, mortgage payments, rent, health insurance, Netflix, utilities, and more
• With that information, we are able to predict accurately and subtract how much money you are expected to spend for any selected time frame
(2) Other Outflow
• Other uses of cash that decreases your Cash Balance (such as one-time purchases)
• This cash outflow will be subtracted from your Cash Balance automatically when you spend the money
• In example, if you make an unexpected purchase of $500, your Cash Balance will go down automatically when the charge shows up in your synced financial account
INVESTMENTS BALANCE FORECAST
The Investments Balance Forecast shows your expected Investments Balance for any date in the future.

(A) Today’s Investments Balance from Your Synced Accounts
The amount of investments you have today from your synced financial accounts. We get this data from your synced accounts and it’s updated on its own as your balance goes up or down. The types of accounts included are brokerages, retirement accounts (401k, 403b, 457, SEP, IRA), and others.
(B) 7.3% Average Annual Return
The expected return rate for your current investments.
(1) Why 7.3%?
• The S&P 500 Index is the benchmark of the United States stock market performance dating back to 1957
• The S&P 500 has returned 10.5% every year in average
• Adjusting for inflation, we assume 7.3% average annual growth for your currently held investments
(2) What is the S&P (Standard & Poor’s) 500?
• The S&P 500 measures the value of the stocks of the 500 largest US corporations by market capitalization listed on the New York Stock Exchange or Nasdaq Composite
• The S&P 500 is considered an effective representation for the economy by covering all areas of the United States and across all industries
• To ensure it is representative of the United States economy, the companies in the S&P 500 are monitored and readjusted as new companies grow to be in the top 500 and legacy companies fall out
(3) Bottomline
• Owning and investing in stocks, index funds, mutual funds, ETFs and alike is a key driver in growing your wealth
• Those who’ve accumulated significant amounts of wealth have done so by earning a living, saving, and investing over decades
• Starting early is always better because more time in the market means less volatility, less risk, and more compound interest growth for your portfolio
• The more you put into your investments portfolio, the better your financial future will look
ASSETS BALANCE FORECAST
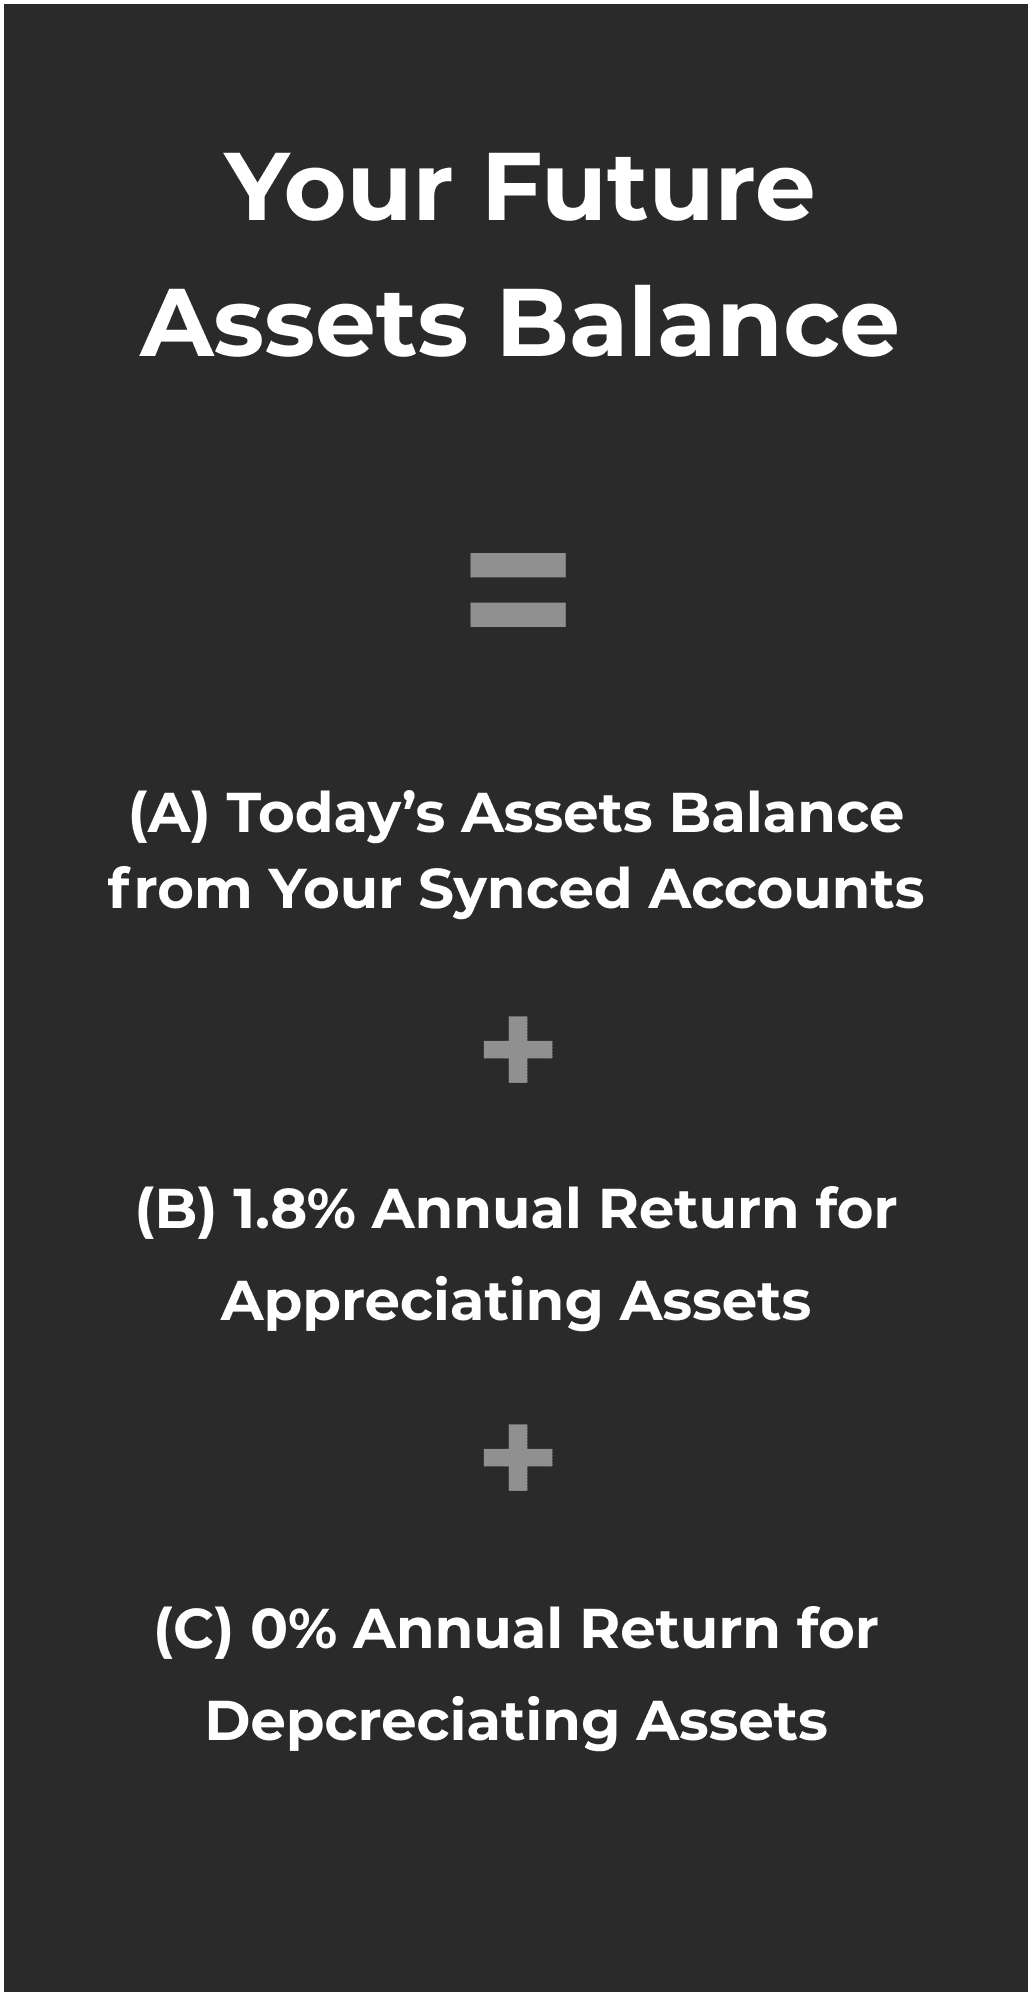
The Assets Balance Forecast shows your expected Assets Balance for any date in the future.

(A) Today’s Assets Balance from Your Synced Accounts
The amount of assets you have today from your synced financial accounts. We get this data from your synced accounts and it’s updated on its own as the current value moves up or down.
(B) 1.8% Average Annual Return for Appreciating Assets
The expected return rate for your current appreciating assets.
(1) What is an appreciating asset?
• An appreciating asset increases in value over time
• Examples of appreciating assets include real estate, such as single family homes, duplexes, and apartment complexes
• Due to economic growth, limited housing, demographic changes, or other additional reasons, real estate prices are almost guaranteed to go up in the long run
(2) Why 1.8%?
• Since 1913, the US housing prices have increased by 5% in average
• Adjusting for inflation, we assume 1.8% average annual growth for your current appreciating assets
(3) Bottomline
• Owning and investing in appreciating assets is a key driver in growing your wealth
• Those who’ve accumulated significant amounts of wealth have done so by earning a living, saving, and investing over decades
(C) 0% Average Annual Return for Depreciating Assets
The expected return rate for your current depreciating assets.
(1) What is a depreciating asset?
• A depreciating asset decreases in value over time
• Examples of depreciating assets include cars, boats, jewelry, equipment, and more
• It is difficult to project the future of depreciating assets, as they each vary and unpredictable factors can affect the value of such assets
(2) Why 0%?
• Given the unpredictable nature of depreciating assets, we assume the value to stay constant over time
• You are able to manually adjust the value of depreciating assets as time passes
(3) Bottomline
• While depreciating assets provide fun and are sometimes necessary, we recommend limiting depreciating assets in your portfolio to maximize your net worth growth and trajectory
DEBT BALANCE FORECAST
The Debt Balance Forecast shows your expected Debt Balance for any date in the future.

(A) Today’s Debt Balance from Your Synced Accounts
The amount of debt you have today from your synced financial accounts. We get this data from your synced accounts and it’s updated on its own as your balance goes up or down. The types of accounts included are mortgages, student loans, auto loans, personal loans, and credit cards.
(B) Your Debt Payments
The regular monthly debt payments you pay every month.
(1) Your Loan Payments
• Your recurring loan payments
• We ask you to connect your loan financial institutions
• With that information, we are able to predict and subtract how much you will pay in loan payments every month and when your payments will end
• Your current loan balance is always updated for the latest balance
• Your future loan balance is calculated by subtracting the number of debt payments you will make in the selected frame
(2) Credit Cards
• Your outstanding credit card balances
• We ask you to connect your credit card institutions
• Given people’s credit card payment habits vary greatly, we do not forecast future credit card balances
• While we don’t forecast your credit card balance to go up or down, note that if you do pay off balances, the current balance will automatically update for you